Not Just Another AWS CloudWatch Tutorial
AWS CloudWatch plays a critical role for most deployments. It provides several capabilities from log management to generating alarms, dashboards and handling events. In this tutorial, we will cover an overview of CloudWatch, it’s capabilities, basic usage, and some best practices.
CloudWatch Overview
CloudWatch Key Capabilities
CloudWatch offers the following key capabilities.
- Log Management:
- You can publish logs to CloudWatch – both application and any system logs.
- You can retrieve logs and also perform basic analysis using the CloudWatch console, such as searching for error messages.
- Several services provide integration with CloudWatch, such as lambda and API Gateway. For EC2, you can use the CloudWatch agent to publish logs to CloudWatch.
- CloudWatch is often used for log consolidation from several different components. For example, you may have logs coming from your EC2 servers, API Gateway, and so on.
- CloudWatch is designed for scale and you can store a huge amount of logs. In fact, it does not purge out logs by default unless you set an expiry. Hence, you must make sure to set out an appropriate expiry on the Log Groups to avoid getting a huge bill.
- Metrics
- CloudWatch supports capturing metrics that can be later used for various purposes, such as reporting or taking an action. It offers several out-of-the-box metrics. For example, you could monitor the CPU utilization of your EC2 instances.
- CloudWatch also offers AWS Custom Metrics. These metrics are provided by AWS tools, such as the CloudWatch Agent for EC2 that can report AWS Custom Metrics like memory and disk utilization.
- Custom Metrics can also be published to CloudWatch. These are often used to take advantage of CloudWatch reporting and action capabilities. For example, you could have a metric to capture errors in the logs and trigger an email when that metric count is greater than 1. A custom metric need not always be technical. You could also use it for business purpose, such as to report a transaction above a certain monetary value.
- Alarms
- An alarm is used to take one or more actions on a metric, such as send an email.
- AWS offers various ways to evaluate alarm conditions, such as average, count, sum, etc.
- Monitoring
- CloudWatch offers several monitoring capabilities from near real-time monitoring of metrics to user-created dashboards, which are often used to monitor critical metrics.
- Events
- Events use Rules to handle changes to your AWS resources. For example, when an EC2 instance is started or stopped.
- An Event Rule can also be scheduled, such as to periodically refresh data.
CloudWatch Logs Overview
Let’s understand some details about CloudWatch Logs.
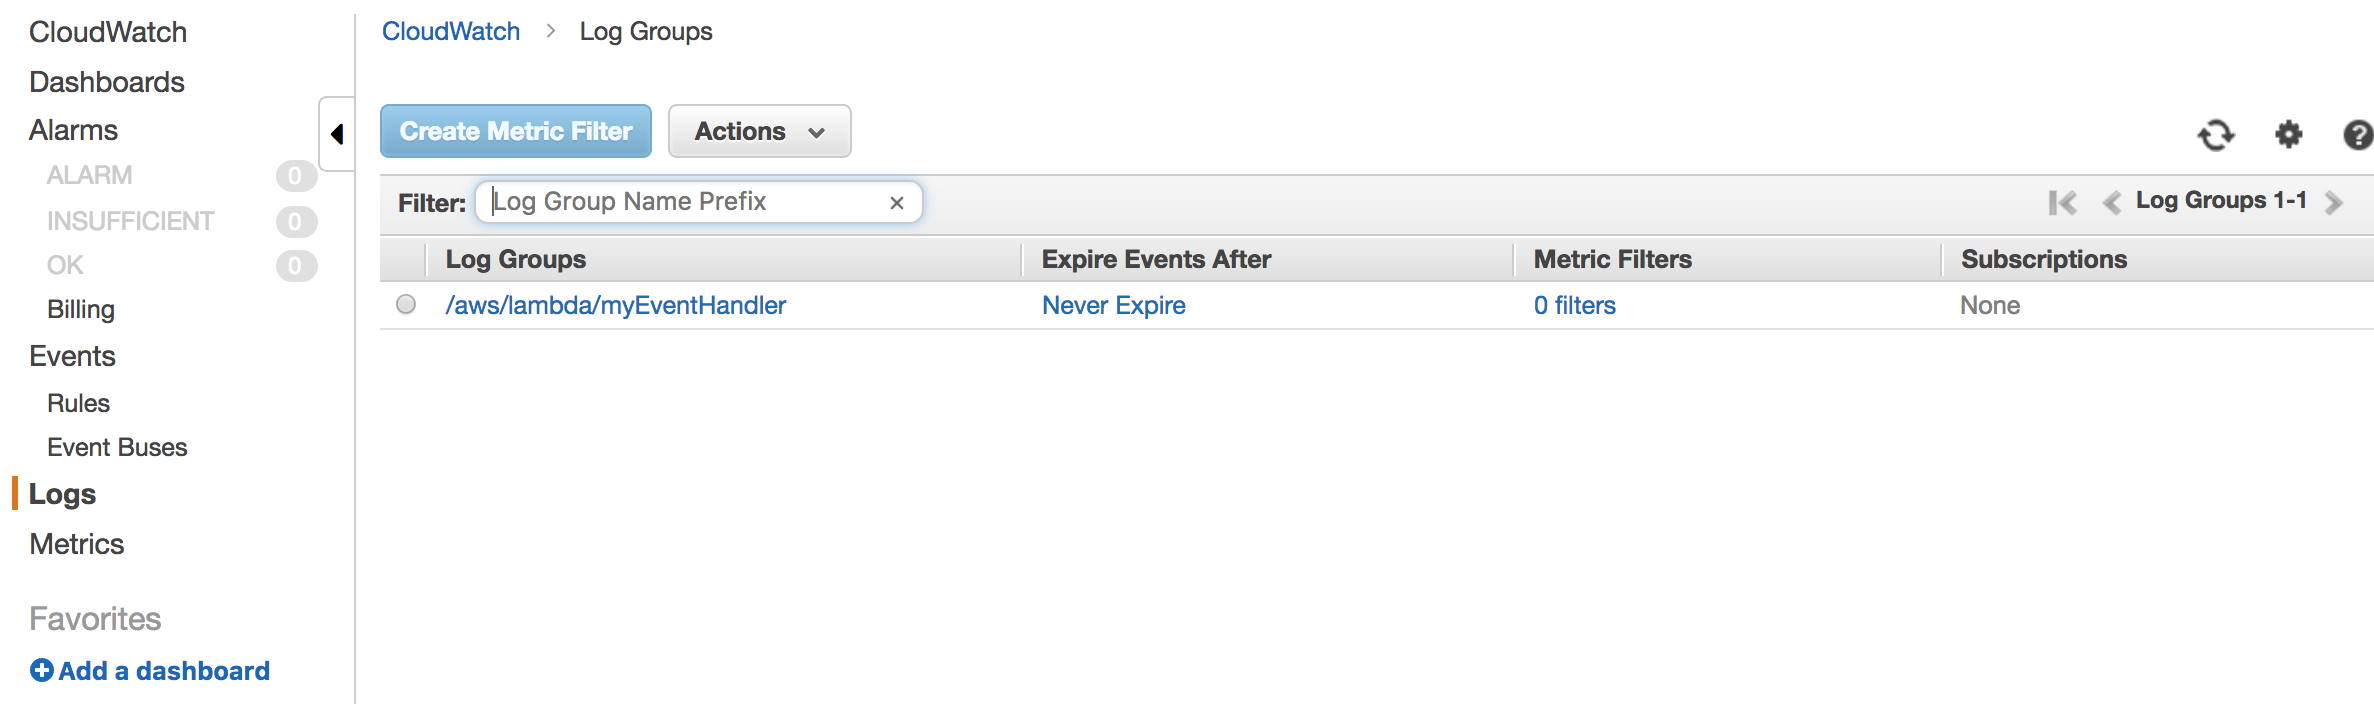
- CloudWatch organizes logs into Log Groups. Think of a Log Group as a folder that represents a micro-service or component in your deployment. For example, you may have a log group for your application tier.
Note: As you can see in the screenshot below, the default expiry is set to “Never Expiry”. Hence, it is a good idea to always set this to a value that meets your deployment needs. For example, for production, you may want to keep logs up to 2 weeks old. But, for development and QA you may be fine to purge out logs that are more than 3 days old. So, configure a value as appropriate for your deployment.

- A Log Group contains one or more Log Streams. Think of a Log Stream as a log file. For AWS services like EC2, typically there will be a Log Stream per EC2 instance. But, for other services like lambda, a Log Stream is for a chunk of time.

- Finally, we have the actual log content within a Log Stream.

- A log entry is always in the UTC time. This way you do not have to convert time into server time. This is especially useful when you have logs from different regions and multiple components.
- CloudWatch maintains a timestamp of when the entry was published.
- You can choose a timeframe to view the logs.
- CloudWatch console offers basic search capabilities for analysis purpose.


CloudWatch Metrics Overview
CloudWatch offers several out-of-the-box metrics. In addition, custom metrics can also be created. Here are the key points about metrics.
- You can look at the currently available metrics from the Metrics view.

- You can drill down into a specific metric. For example, the screenshot below shows the CPUUtilization metric for a specific EC2 instance. This way you can do near real-time monitoring of the metric.
Note: You can adjust the time window based on the needs and you can also save this graph to a dashboard.


CloudWatch Alarms Overview
An Alarm lets you take one or more actions when a given metric threshold is breached and also when it comes back to normal. For example, you may want to send out an alert to an infrastructure team when the CPU utilization of a critical production EC2 instance is high.
Following are the steps to create an alarm.
- Choose a metric Category to help get to the appropriate metric.

- Select the Metric. In the screenshot below, we have selected the CPUUtilization metric for a specific EC2 instance.

- Specify the Alarm details.

- GIve a logical name. Alarms are tied to specific resources. Hence it is useful to give a reference to the resource (or at least type of resource) in the alarm name.
- Give a description for your reference.
- Specify the threshold. Here we are specifying a threshold of 75% for 3 consecutive data points. That is when the CPUUtilization >= 75% for 15 minutes.
- Specify how to handle missing data. This typically happens in the initial state of alarm when data is not yet available. But, it could also happen for other metrics where the reporting may miss a cycle (such as a metric published using a CloudWatch agent).
- Specify the actions. In this case, we are simply stopping the instance.
- Once the alarm has been defined, you can see it on the list of alarms. Initially, the alarm will show INSUFFICIENT_DATA until it has gathered enough metric data to go to the normal state or the alarm state.


CloudWatch Events Overview
CloudWatch Events allow handling of changes to resources, such as when an EC2 instance changes state. Let’s see how to handle a simple Event.
- In order to handle an Event, create an Event Rule.

- Choose an Event Source. It could be an event on an AWS resource or a schedule based execution (similar to a cron job). In this screenshot, we are taking EC2 instance state change events and specifically selecting the running/stopped/terminated.
- The Event Pattern Preview shows a sample event that the event handler can expect. This is helpful as you can copy this as a test event to test out the event handler.
- Specify Targets that would handle the event. You can specify multiple targets. In this case, we have specified a lambda function. When the event occurs, the lambda will be passed an event similar to the one shown in the preview.
- Give a logical name to the rule and create it.

- Once the rule is created it will show on the rules list.


CloudWatch Dashboards Overview
CloudWatch Dashboards make it convenient to monitor commonly observed metrics. These are perfect for Operations teams usage and even for development and testing teams. For example, every time you run performance tests, you would want to monitor and grab the relevant widgets from the dashboard. Following is a sample dashboard that shows memory usage.

- You can create multiple dashboards, such as one per application or even component.
- You can add widgets to an existing dashboard from the Dashboards view or from the Metrics view. A widget shows a chart.
- When you add a widget try keeping metrics with the same unit only so that the dashboard is easy to read.
CloudWatch Best Practices
Following are some key best practices to follow for CloudWatch.
- Use an appropriate naming convention for CloudWatch Log Groups and Log Streams.
- Always set an appropriate expiry for CloudWatch Log Groups. Otherwise, the consolidated logs can lead to a huge bill.
- Like many AWS services, CloudWatch also offers a free tier. Take advantage of it. At the same time keep a watch on the resources to not exceed. Often times certain resource creation processes may create CloudWatch resources behind the scenes, such as Log Groups, alarms, etc. Make adjustments to these as needed and delete ones that you don’t need.
- Use Dashboards for frequently monitored metrics.
- Use metrics with the same unit on a dashboard widget.
Happy learning!
– Nitin
Enhance your AWS skills with these hands-on courses for real-world deployments.
![]()
![]()
Also published on Medium.